
Analyze HAR File: A Comprehensive Guide
Understanding the intricacies of a HAR (HTTP Archive) file is crucial for web developers and performance analysts. A HAR file is a JSON-formatted file that captures all the details of a web page’s performance, including network requests, resource loading times, and more. By analyzing a HAR file, you can gain insights into how your website performs and identify areas for improvement. Let’s delve into the various aspects of analyzing a HAR file.
What is a HAR File?

A HAR file is a record of all the HTTP requests made by a web browser while loading a webpage. It includes information such as request headers, response headers, request and response times, and the size of the resources. This data is invaluable for diagnosing performance issues and optimizing web applications.
How to Generate a HAR File
There are several tools available to generate HAR files. One of the most popular is the Chrome DevTools. To generate a HAR file using Chrome DevTools:
- Open Chrome and navigate to the webpage you want to analyze.
- Right-click on the webpage and select “Inspect” to open the Developer Tools.
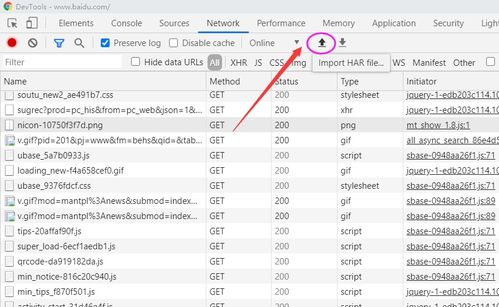
- Click on the “Network” tab to view all the network requests made by the webpage.
- Click on the “Record” button to start recording the network requests.
- Perform actions on the webpage, such as clicking links or submitting forms.
- When you’re done, click the “Stop” button to stop recording.
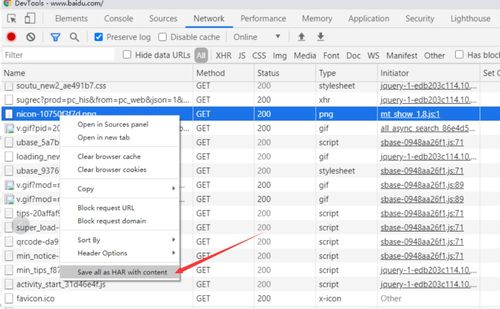
- Right-click on any request and select “Save as HAR with content” to save the HAR file.
Understanding the HAR File Structure
A HAR file is structured as a JSON object, with several key components:
- log: Contains metadata about the HAR file, such as the browser name, version, and the time the file was created.
- entries: An array of individual network requests, each with its own set of properties.
- entries[i].request: Information about the request, including the URL, method, headers, and cookies.
- entries[i].response: Information about the response, including the status code, headers, and the size of the response body.
- entries[i].timings: Timing information for the request, including the time taken to send the request, receive the response, and wait for the response to start loading.
Analyzing Network Requests
One of the primary uses of a HAR file is to analyze network requests. This can help you identify slow-loading resources, unnecessary requests, and other performance bottlenecks.
Here’s a breakdown of the key aspects to consider when analyzing network requests:
- Request Time: The time taken to send the request to the server and receive the response.
- Response Time: The time taken for the server to process the request and send the response back to the browser.
- Wait Time: The time taken for the browser to wait for the response to start loading. This can be caused by network latency or server delays.
- Resource Size: The size of the resource being requested. Larger resources take longer to download and can impact page load times.
Here’s an example of a table showing the network request details for a webpage:
| Request | Request Time | Response Time | Wait Time | Resource Size |
|---|---|---|---|---|
| index.html | 0.0 ms | 0.0 ms | 0.0 ms | 10.2 KB |
| style.css | 0.0 ms | 0.0 ms | 0.0 ms | 5.1 KB |
| script.js |


